The summer is coming to an end, and soon the much anticipated busy Fall Season will begin. I thought I would share this recent report I received from the London and St. Thomas Association of Realtors. I felt this was a great overview of how busy the market was with buying and selling homes. All average home sales across our beautiful city rose from 2017. Continue reading below to read more.
LSTAR’s News Release for August 2018
Solid Home Sales in August Cap a Strong Summer Season
London and St. Thomas Association of REALTORS® (LSTAR) announced 923 homes* were sold in August, up 2.2% over the same time last year. August 2018 marked the second best August for home resales since the Association began tracking sales data in 1978. August 2016 holds the record, with 999 home resales.
“It was a very strong summer for home resales, with August achieving very solid numbers,” said Jeff Nethercott, 2018 LSTAR President. “Resale activity has performed high above the 10-year average, despite low inventory, which the marketplace has experienced all year. The average sales price continues to rise: it was $378,511, up 18.0% from August 2017. When you go back five years, that’s up 54.2% compared to August 2013.”
Breaking it down by geography, London South (which also includes data from the west side of the city) had an average sales price of $381,636, up 17.5% from August 2017 and up 55.8% from August 2013. London East continues to experience a steady gain in average sales price, coming in at $287,162, up 16.6% from August 2017 and up 38.9% from August 2013. Meanwhile in London North, the average sales price was $466,654, up 11.9% from August 2017 and up 57.3% from August 2013.
“Average home sales price may be up across the region, but we continue to experience a 10-year historical low in inventory,” Nethercott said. “In August, there were 1,535 active listings, down 12.6% from this time last year and down 57.6% from August 2013. The sales-to-new listings ratio was 85.1%, which the Canadian Real Estate Association (CREA) says represents conditions in the marketplace that favour sellers (a ratio between 40% and 60% is generally consistent with a balanced market). Going back to August 2013, the sales-to-new listings ratio for the region was 54.5%. In August, London North had a sales-to-new listings ratio of 92.1%, while in London South it was 90.8%.”
St. Thomas saw a total of 66 homes sold in August, up 11.9% from the same period last year. For inventory, there were 98 active listings, down 10.9% from last August and down 59.8% from August 2013. The average home sales price in St. Thomas was $295,262 up 17.2% from August 2017 and up 46.9% from August 2013.
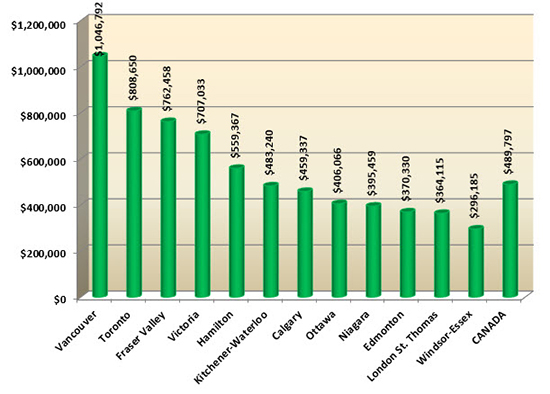
The following chart is based on data taken from the CREA National MLS® Report for July 2018 (the latest CREA statistics available). It provides a snapshot of how average home prices in London and St. Thomas compare to other major Ontario and Canadian centres.